Advanced Geospatial Artificial Intelligence reveals infrastructure exposure to hidden flood risks
Flood modeling in arid environments like Saudi Arabia is constrained by the absence of reliable hydrological datasets and extreme variability in topography. To overcome these limitations, the study integrates digital elevation models (DEMs), geographic information systems (GIS), and advanced ensemble-based machine learning algorithms.
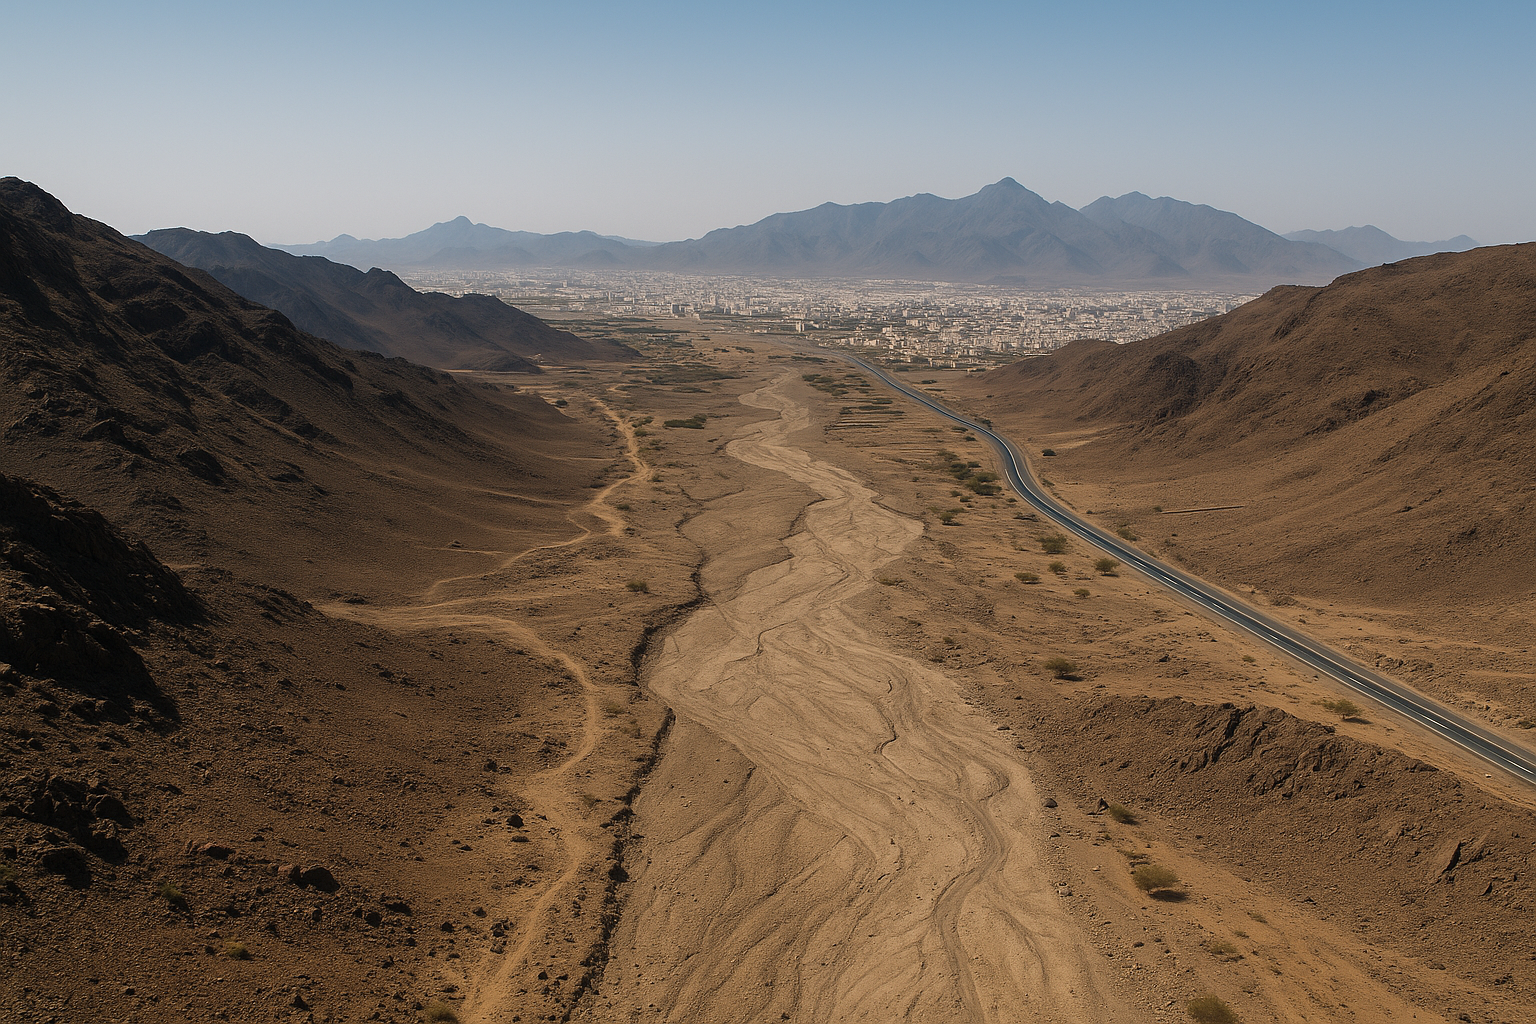
In a significant step toward enhancing climate resilience in arid regions, researchers from King Saud University and the University of Texas at Austin have introduced an advanced machine learning framework to assess flood risk in Saudi Arabia's Wadi Ranuna basin. The study integrates morphometric geomorphology with advanced Geospatial Artificial Intelligence (GeoAI) to model flood susceptibility zones in one of the Kingdom’s most hydrologically vulnerable areas.
Published in Water, the study “Quantitative Assessment of Flood Risk Through Multi Parameter Morphometric Analysis and GeoAI: A GIS-Based Study of Wadi Ranuna Basin in Saudi Arabia,” leverages gradient boosting models, geospatial analytics, and unsupervised clustering to pinpoint flood-prone sub-basins in Medina. It aims to support evidence-based urban planning, particularly as Saudi Arabia intensifies its infrastructure investments under Vision 2030.
How can GeoAI improve flood prediction in data-scarce arid zones?
Flood modeling in arid environments like Saudi Arabia is constrained by the absence of reliable hydrological datasets and extreme variability in topography. To overcome these limitations, the study integrates digital elevation models (DEMs), geographic information systems (GIS), and advanced ensemble-based machine learning algorithms.
The researchers extracted 23 morphometric parameters across 67 sub-basins using a 30-meter resolution Shuttle Radar Topography Mission (SRTM) DEM. These parameters, grouped into basin geometry, topography, drainage network, and surface texture metrics, were processed through machine learning models including Gradient Boosting (GB), Random Forest (RF), and XGBoost. Each model was tasked with predicting a continuous Flood Susceptibility Index (FSI) and binary flood occurrence classification.
The FSI was derived from a weighted combination of five influential morphometric factors, drainage density, stream frequency, slope, relief ratio, and form factor, assigned using the Analytical Hierarchy Process. Historical flood events from 2010 to 2024 were used to validate the models, showing that 78 percent of past flood incidents occurred in zones marked by high or very high susceptibility scores.
Among the models tested, Gradient Boosting emerged as the most accurate, with a root mean square error (RMSE) of 6.50 and an R² of 0.9212. For binary classification, GB and XGBoost each achieved an accuracy rate of 92.31 percent and demonstrated perfect recall for identifying flood-prone sub-basins. In contrast, Random Forest lagged behind with a lower accuracy of 84.62 percent and signs of overfitting.
What do the findings reveal about Wadi Ranuna’s flood risk profile?
The study provides a comprehensive characterization of the Wadi Ranuna basin, revealing several inherent geomorphological features that influence its flood dynamics. The basin spans 188.18 square kilometers, with a perimeter of 101.71 km and an elongated shape marked by a form factor of 0.17 and a circularity ratio of 0.23. These shape parameters suggest a natural capacity for flood moderation through gradual runoff dispersion.
Despite these favorable morphological features, the area exhibits moderate drainage density (2.09 km/km²) and stream frequency (3.24 streams/km²), conditions that, when combined with low slope gradients, increase surface runoff and reduce infiltration. Approximately 90 percent of the basin features slope gradients under 10 degrees, with 38 percent classified as flat terrain. These flat zones are particularly prone to water pooling and flood accumulation.
The drainage network includes 610 streams distributed across six hierarchical orders. First-order streams dominate, accounting for nearly half the total stream segments. Notably, the bifurcation ratio between fifth- and sixth-order streams exceeds 10, indicating potential points of extreme flow concentration that exacerbate flood risk.
Cluster analysis further segmented the basin into three distinct morphometric zones using K-Means and DBSCAN clustering techniques. Cluster 1, covering 28 percent of sub-basins, demonstrated the highest flood susceptibility, characterized by high stream frequency, drainage density, and drainage texture values. Conversely, Cluster 2 featured more favorable drainage characteristics, including higher relief ratios and lower stream density, resulting in reduced flood risk.
Where are the high-risk areas and what are the urban planning implications?
The spatial analysis of predicted flood susceptibility revealed that 12.3 percent of the basin, approximately 23.1 square kilometers, is classified as having very high flood risk. These areas are concentrated in the central and southern portions of the valley, where geomorphic factors such as flat slopes, dense stream networks, and intermediate relief amplify flood potential.
Of particular concern is the intersection between high-risk zones and current infrastructure. The study found that 67 percent of existing development falls within high or very high susceptibility areas. This includes 23 kilometers of major roads and eight critical public facilities, such as schools and healthcare centers. The convergence of fifth- and sixth-order streams in these areas further increases the hazard level, posing significant risks to both public safety and property.
GeoAI tools were also used to assess feature importance through SHapley Additive exPlanations (SHAP). The results highlighted stream frequency, overland flow length, and drainage texture as the most influential predictors of flood risk. Threshold effects were observed, with flood risk spiking significantly in areas where stream frequency exceeded 3.0 streams/km² and drainage texture ranged from 5 to 8.
The study recommends that urban expansion near critical convergence points be tightly regulated. In areas with low slope gradients and high drainage texture, land use policies should restrict impervious development to avoid overwhelming the natural drainage capacity. Moreover, the identification of outlier sub-basins through DBSCAN points to regions that require field-level hydrodynamic validation, given their unpredictable runoff behavior.
- READ MORE ON:
- GeoAI for flood risk assessment
- machine learning flood modeling
- flood hazard mapping in arid basins
- Saudi Vision 2030 urban planning
- climate resilience in arid environments
- arid watershed flood planning
- Quantitative Assessment of Flood Risk Through Multi Parameter Morphometric Analysis and GeoAI
- FIRST PUBLISHED IN:
- Devdiscourse


